East Peoria has an estimated 2,419 renter households and a 24.3% renter share. Use that context to investigate an actual trade area, then evaluate the store’s verified receipts, premises rights, equipment and staffing. A city profile cannot establish a particular business’s value.
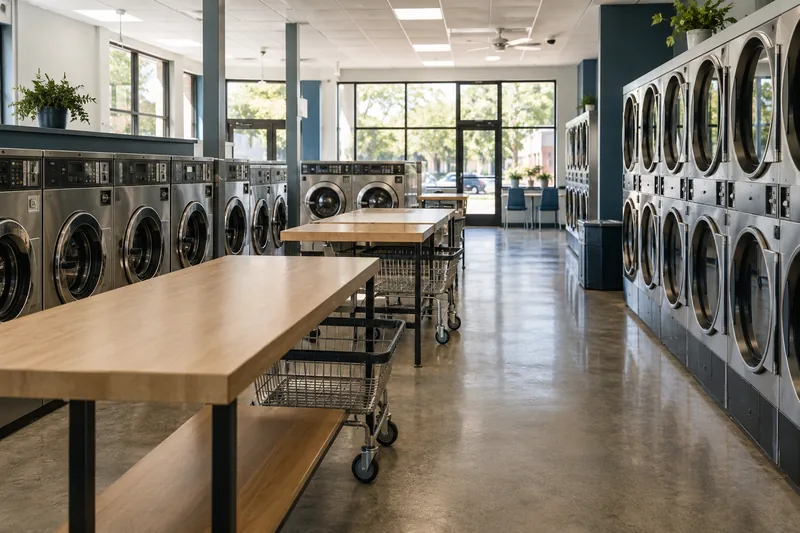
What the housing data suggests in East Peoria
Tenure and the potential service question
Only 24.3% of occupied housing in East Peoria is renter-occupied in the ACS estimate: 2,419 households within an occupied base of 9,975. That makes a broad “renter-heavy market” description inappropriate for the municipality. An existing store may still have a viable catchment, but the investment case needs to identify the actual customers and the alternatives available to them.
Do not substitute affluence or total population for evidence of laundry demand. Ask whether receipts come from a specific apartment cluster, bulky-item visits, staffed services, or customers arriving from outside the municipality. A seller’s presentation is stronger when that story is supported by operating records; a buyer should verify it without assuming a premium-service opportunity.
Structures and customer access
East Peoria’s 16.2% multi-unit housing share represents about 1,769 units in a total housing estimate of 10,915. A low municipality-wide share makes the location of individual rental or service-demand pockets especially relevant. It does not show that a laundry is unviable; it shows why the specific site must carry the explanation.
For a candidate store, identify the route from each plausible customer cluster, the convenient competing options and any staffed-service demand that is already documented. Avoid valuing hypothetical pickup-and-delivery growth as if it were existing self-service income. The two activities have different labor, route and customer-acquisition costs.
Housing age and the inspection plan
The ACS estimates that 70.3% of housing units in East Peoria were built before 1980, approximately 7,669 units. This is a reason to inspect renovations and building laundry arrangements; it is not proof that older homes lack machines. Substantial upgrades can change customer needs without changing the original construction date.
Older premises also make a technical walkthrough worthwhile. Ask about water service, drainage, electrical capacity, gas, venting and landlord responsibility for improvements at the actual laundry. An attractive equipment quote is incomplete if the building work required to install the machines has not been priced.
Population context for East Peoria
East Peoria’s Vintage 2024 population estimate is 22,024, against a 2020 estimates base of 22,493: an approximate change of -2.1%. A smaller estimated municipal population does not determine an individual store’s result, but it warrants a careful look at customer retention, competition and the relevant housing pockets.
Compare the store’s own monthly history with operational changes, nearby closures or openings and changes in building amenities. A business can gain or lose share while the city follows a different trend. Underwrite the recorded operation and a downside case rather than assuming either inevitable decline or an automatic turnaround.
Compare East Peoria with nearby guides
| Nearby guide | Renter households | Renter share | Multi-unit share |
|---|---|---|---|
| Peoria | 20,847 | 42.5% | 31.6% |
| Normal | 9,220 | 45.2% | 43.9% |
| Bloomington | 13,282 | 38.1% | 34.2% |
Among these comparison places, Normal has the highest renter share at 45.2%, while Bloomington is at 38.1%. East Peoria is 20.9 percentage points below Normal. Compare absolute households as well as percentages: they answer different questions about scale and housing mix.
The comparison places are the nearest other covered cities by Census internal-point coordinates. This is an orientation tool, not a driving-distance calculation, a retail trade-area boundary or evidence that their laundromats compete directly. Inspect the actual routes, housing and alternatives around a candidate address.
Three comparisons to guide local fieldwork
East Peoria and Peoria: scale and housing mix
The estimated renter base in East Peoria is 2,419, compared with 20,847 in Peoria. The difference is approximately 18,428 renter households, with East Peoria at about 0.12 times the Peoria count. Renter share tells a separate part of the story: 24.3% in East Peoria versus 42.5% in Peoria, a 18.2-percentage-point gap. Use both absolute scale and concentration when selecting addresses to investigate.
In this pair, the larger difference between the two housing-form measures is the multi-unit share: 16.2% for East Peoria and 31.6% for Peoria (15.4 percentage points). The pre-1980 shares are 70.3% and 69.0%. For fieldwork, compare the laundry facilities and access routes in the actual multi-unit clusters before applying an operating model from one place to the other. More units in a shared structure do not necessarily mean fewer laundry amenities.
Population context also differs: East Peoria is estimated at 22,024 in Vintage 2024, while Peoria is at 111,696. Changes from their respective 2020 bases are -2.1% and -1.4%. Compare the store’s own monthly trend with those observations rather than assuming a population trend flows directly into receipts. See the Peoria guide for its underlying counts and preparation questions.
East Peoria and Normal: scale and housing mix
The estimated renter base in East Peoria is 2,419, compared with 9,220 in Normal. The difference is approximately 6,801 renter households, with East Peoria at about 0.26 times the Normal count. Renter share tells a separate part of the story: 24.3% in East Peoria versus 45.2% in Normal, a 20.9-percentage-point gap. Use both absolute scale and concentration when selecting addresses to investigate.
The larger housing-form difference in this comparison is construction period: 70.3% of East Peoria housing predates 1980 versus 40.3% in Normal, a 30.0-point difference. Multi-unit shares are 16.2% and 43.9%. Ask about renovations and present-day laundry access when comparing the two areas; the original build date does not establish the equipment inside a home or building. A store’s recorded service mix should support the choice of machines and staffing.
Population context also differs: East Peoria is estimated at 22,024 in Vintage 2024, while Normal is at 53,304. Changes from their respective 2020 bases are -2.1% and 0.5%. Compare the store’s own monthly trend with those observations rather than assuming a population trend flows directly into receipts. See the Normal guide for its underlying counts and preparation questions.
East Peoria and Bloomington: scale and housing mix
The estimated renter base in East Peoria is 2,419, compared with 13,282 in Bloomington. The difference is approximately 10,863 renter households, with East Peoria at about 0.18 times the Bloomington count. Renter share tells a separate part of the story: 24.3% in East Peoria versus 38.1% in Bloomington, a 13.8-percentage-point gap. Use both absolute scale and concentration when selecting addresses to investigate.
The larger housing-form difference in this comparison is construction period: 70.3% of East Peoria housing predates 1980 versus 47.8% in Bloomington, a 22.5-point difference. Multi-unit shares are 16.2% and 34.2%. Ask about renovations and present-day laundry access when comparing the two areas; the original build date does not establish the equipment inside a home or building. A store’s recorded service mix should support the choice of machines and staffing.
Population context also differs: East Peoria is estimated at 22,024 in Vintage 2024, while Bloomington is at 79,232. Changes from their respective 2020 bases are -2.1% and 0.7%. Compare the store’s own monthly trend with those observations rather than assuming a population trend flows directly into receipts. See the Bloomington guide for its underlying counts and preparation questions.
These comparisons are descriptive, not tests of statistical significance or rankings of store returns. ACS sampling error can be material, especially for small places. Use the differences to choose what to inspect and which documents to request; do not price an individual store from a small percentage gap.
Preparing a East Peoria laundromat for sale
Document the actual customer base
With a 24.3% renter share, show how the store attracts and retains its existing customers. Distinguish demonstrated service-laundry revenue from possible future growth.
Explain the operation after you leave
Record who performs cleaning, collections, customer assistance and maintenance coordination. Price the replacement work rather than describing the business as passive.
Support the premises economics
Give a buyer the lease package and additional-rent history. A demographic story cannot compensate for unclear transfer rights or unpriced occupancy obligations.
Use the seller preparation checklist to organize the package before deciding what to release. The selling process guide explains inquiry qualification, staged disclosure and the decisions behind the complete offer.
Buyer questions to resolve at the address
- Which specific housing clusters can reach this East Peoria address conveniently, and what laundry options are already available there?
- How do the store’s verified receipts compare across periods while East Peoria’s wider housing mix stays separate from the operating model?
- Which documented customer segments support the store in an area with a lower multi-unit housing share?
- What building upgrades have changed laundry access in older nearby housing?
- What does an installed equipment budget include beyond the machines: removal, utility work, permits and downtime?
- Which lease rights, software accounts, service contracts and approvals can transfer to a buyer?
- After replacing the seller’s labor and funding maintenance and debt, how much cash remains under a downside case?
Put the unanswered questions into a request log with a responsible party and the evidence needed to resolve each one. Use the diligence process guide to sequence specialist work after the basic financial and premises facts are credible.
Keep city context separate from value
There is no supported city-specific laundromat multiple in this profile. National reported sold-business benchmarks can frame a pricing discussion, but the actual income definition, assets, lease, equipment obligations and owner role determine whether a comparison fits. Real estate should be valued separately from the operating business.
Try the transparent value workspace with verified SDE, then use the cash-flow calculator to test replacement labor, capital reserves and financing. Treat those outputs as scenarios built from your inputs rather than a prediction that the store will achieve a return.
Data definitions and limits
| Measure | Value for East Peoria | What it does and does not mean |
|---|---|---|
| Occupied homes | 9,975 | The denominator for the tenure share; excludes vacant housing. |
| Renter-occupied homes | 2,419 ± 396 | ACS estimate and published 90% margin of error for this count; not a customer count. |
| Housing units in 2+ unit structures | 1,769 | Includes different tenure and amenity arrangements; denominator is all housing units. |
| Housing built before 1980 | 7,669 | A construction-period estimate; does not reveal renovations or washer access. |
Housing values are period estimates from the same ACS release. A margin of error shown for the renter count does not automatically describe the uncertainty in the computed percentage; that requires a separate ratio calculation. The other table counts also have published margins of error in the source files. Small geographic differences should not be treated as precise rankings.
Multi-unit share sums B25024 categories for structures with two or more units. Pre-1980 share sums the applicable construction periods in B25034. The population change compares the Vintage 2024 estimate with that vintage’s 2020 estimates base; it is not an annual forecast. City boundaries and the actual service area can differ substantially.
Sources and review notes
Reviewed October 15, 2026. Primary references support the specific topics below. Practical checklists and explicitly labeled scenarios are our editorial analysis, not reported market outcomes.
- U.S. Census Bureau: 2020–2024 ACS summary-file data
B25003 tenure, B25024 units in structure and B25034 year built. City averages do not measure in-unit laundry or a store trade area. - U.S. Census Bureau: Illinois incorporated-place population estimates
Vintage 2024 estimates; population date July 1, 2024. These are distinct from ACS period estimates. - U.S. Census Bureau: 2025 Illinois place Gazetteer
Place names, identifiers, land area and internal coordinates; coordinates are not retail trade-area boundaries.
Use this material to prepare questions and documents. A specific transaction needs its own legal, tax, lending and equipment review.
Discuss a laundromat in East Peoria
Talk through the actual store, your goals and the records that would support the next decision. No sensitive uploads are required to start.
Discuss your next step